library(tidyverse)

my_file <- here::here("2021", "data-2021-09.txt")
x <- readLines(my_file)2021 Day 9
— Day 9: Smoke Basin —
Avoid the smoke!
Find all of the low points on your heightmap. What is the sum of the risk levels of all low points on your heightmap?
Maybe write an explanation of the solution approach here
cave_width = nchar(x[[1]])
cave_length = length(x)

smokes_L = stringr::str_split_fixed(x, "", cave_width) %>% as.data.frame()
smokes_L = sapply(smokes_L, as.numeric)

smokes = array(NA, c(102, 102))
smokes[2:101, 2:101] = smokes_L

lowpoints = vector()

for (i in seq(2, cave_width+1)) {
    for (j in seq(2, cave_length+1)) {
      surr = c(smokes[i,j], smokes[i-1,j], smokes[i+1,j],
               smokes[i,j-1], smokes[i,j+1])
      if (min(surr, na.rm=TRUE) == smokes[i,j]
          & smokes[i,j] != 9) {
            lowpoints = append(lowpoints, smokes[i,j])
            # print(i)
            # print(j)
        }
    }
}

sum(lowpoints) + length(lowpoints)
[1] 504— Part Two —
Avoid the big basins!
What do you get if you multiply together the sizes of the three largest basins?
cave_width = nchar(x[[1]])
cave_length = length(x)

smokes_L = stringr::str_split_fixed(x, "", cave_width) %>% as.data.frame()
smokes_L = sapply(smokes_L, as.numeric)

smokes = array(NA, c(102, 102))
smokes[2:101, 2:101] = smokes_L

# basin_tracker
basin_t = array(NA, c(102, 102))

basin_num = 0

for (k in seq(40)) {
    for (i in seq(2, cave_width+1)) {
        for (j in seq(2, cave_length+1)) {
            surr = c(basin_t[i-1,j], basin_t[i+1,j],
                     basin_t[i,j-1], basin_t[i,j+1])
            if (smokes[i,j] == 9) {
                # if it is a 9 do nothing, keep as NA
            } else if (any(surr[!is.na(surr)])) {
                # if there is a basin number in any surrounding spot,
                # adopt that number
                basin_t[i,j] = min(surr[!is.na(surr)])
            } else {
                # if we find no surrounding basin number,
                # add one to the basin and start a new basin counter
                basin_num = basin_num + 1
                basin_t[i,j] = basin_num
            }
        }
    }
}

counter = sort(table(unlist(basin_t)), decreasing=TRUE)
counter[1][[1]] * counter[2][[1]] * counter[3][[1]]
[1] 1558722basin_count = basin_t %>%
as.data.frame() %>%
mutate(rr = row_number()) %>%
pivot_longer(cols = -rr, names_prefix = "cols") %>%
count(value) %>%
arrange(desc(n))
# part two answer
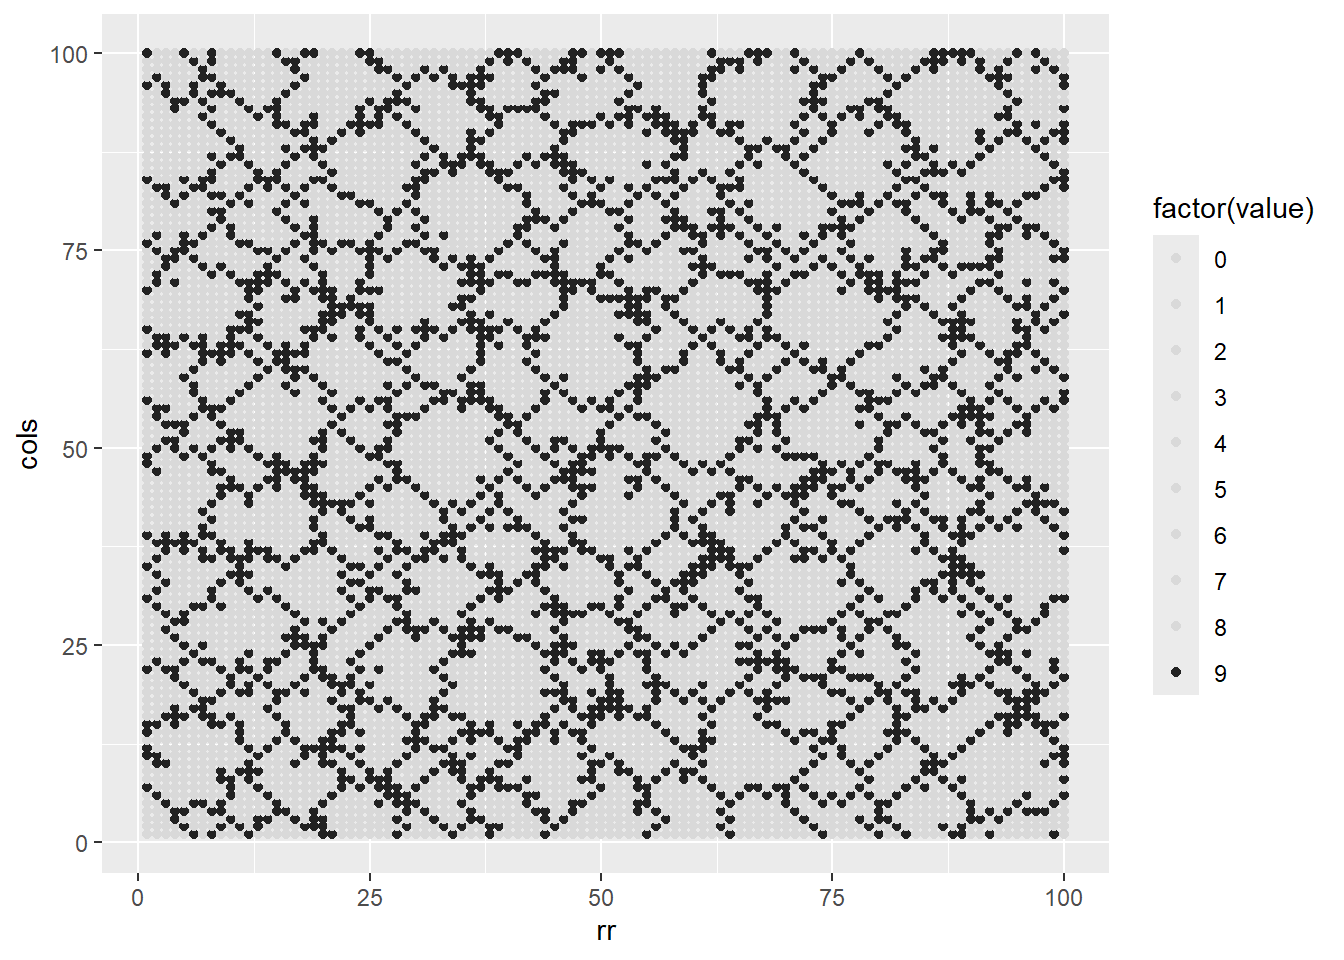
prod(basin_count$n[2:4])[1] 1558722Let’s make a chart for fun
cave_width = nchar(x[[1]])
cave_length = length(x)

smokes = stringr::str_split_fixed(x, "", cave_width) %>% as.data.frame()
smokes = sapply(smokes, as.numeric)

smoker = smokes %>%
    as.data.frame() %>%
    mutate(rr = row_number()) %>%
    pivot_longer(-rr, names_to = "cols") %>%
    mutate(cols = parse_number(cols))

smoker %>%
    ggplot(aes(rr, cols, colour = factor(value))) +
    geom_point() +
    scale_color_brewer(palette = "Set3")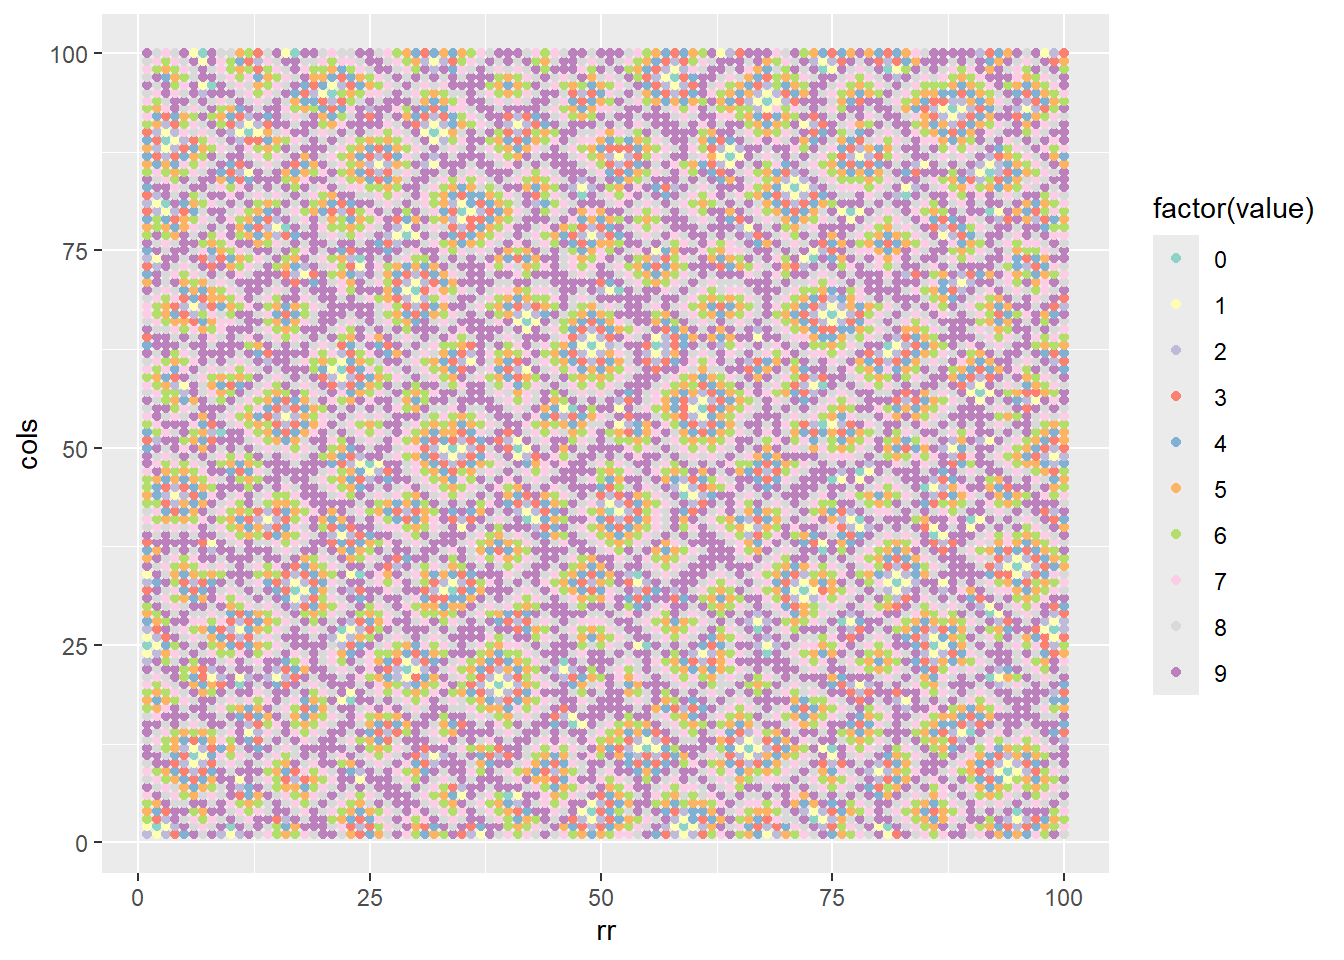
basin_grey = c("#D9D9D9", "#D9D9D9", "#D9D9D9", "#D9D9D9", "#D9D9D9", "#D9D9D9", "#D9D9D9", "#D9D9D9", "#D9D9D9", "#222222")

smoker %>%
    ggplot(aes(rr, cols, colour = factor(value))) +
    geom_point() +
    scale_color_manual(values = basin_grey)